The Growth and Success of Toronto:
The Role of the City's Port in its Development during the 19th Century
Olivia Hall
Toronto - 2023
Toronto did not become a thriving metropolitan city overnight. The lively city that exists today is a product of more than 200 years of trade, commerce, innovation, and manufacturing. Precisely, it took a name change, an economic crisis, the development of steam engines, and keen citizens to build the Toronto of today. The Port of Toronto is arguably the most important attribute of the city’s success and development. Located on Lake Ontario, the Port of Toronto is a commerce and trading hub that connects the Upper and Lower Lakes. As a result of the development of the canals and technological innovations in port and ship design, ports, such as Toronto, have contributed to the expansion of staple markets and the rise of urban coastal populations across the Great Lakes.
The Port of Toronto originates back to the mid-18th century when the French created Fort Rouille.1 The creation of this trading post led to a positive relationship between the European settlers and First Nations not only in regards to trading but in later years when the Seven Years War broke out an alliance was formed between the two groups because of the successful commerce that took place at the Fort.2 The port has seen many changes over the past 300 years, shaping its environment and supporting increased populations. Trade was a driving factor in the urbanization of Toronto as that is where its roots lay.

Toronto, known as York until 1834, was already a respected and important city. It was able to support its early settlers who resided in the town and along the outskirts and farms. Toronto had well-developed streets, various shops, and a reliable harbour which can be exhibited through a map from 1842 (Figure 1).3 The Toronto Board of Trade was created informally in 1835 and was one of the first created in Canada.4 Businessmen in Toronto recognized the need for one as commercial businesses were growing and trade was becoming an even bigger factor in the economy. It is noted that the Board of Trade in Toronto was frequently most concerned with transportation, they felt that Toronto deserved to be involved in the “country’s developing network of rails, roads, and waterways” and always to maintain the stability of their rates and tariffs.5
With the implementation of the Board of Trade in Toronto because of increased trade, a rise in the economy, came an economic crash in 1847. Multiple factors contributed to Toronto’s economy taking a hit. The Industrial Revolution in conjunction with the Repeal of the Corn Laws enabled the Canadian economy, by omitting the taxes for staple goods such as timber and wheat. Originally there was a preferential tariff in place for timber and wheat, meaning that Canada had lower rates of taxes for these exports which significantly helped their economy.6 But Britain systemically removed these and opened themselves up to free trade, now allowing competing countries to flourish.7 At the same time, the Great Irish Famine had been impacting the city of Toronto as thousands of Irish immigrants were fleeing to British North America, and the massive surge of people created even more chaos within the city. But these setbacks within the economy only allowed for new opportunities.8 The economic and technological changes provided an opportunity for Canadians to manufacture and export their own goods. Industries were now on the rise which meant ports, such as Toronto were seeing far more progression. As trade increased, and the port expanded, an administrative body was required to oversee managing the port. With the support of the Toronto Board of Trade, the Commissioners of the Harbour of Toronto (or the Harbour Trust) was now formally created in 1850 and they were tasked with supporting labour, infrastructure, and regulation of shipping within Toronto Bay.9 The establishment of the Board of Toronto and the Harbour Trust highlights the importance of the port by the 1850s and indicates a considerable investment in the development of Toronto’s marine sector.

The influx in commerce taking place at the Port of Toronto can be examined through multiple primary sources. The Welland Canal Register is a useful historical record for analyzing shipping through the second and third Welland Canals, opened in 1845 and 1887 respectively.10 The Welland Canal was required to support the increase in ships travelling through the waterways, providing a convenient and safe way for vessels to bypass Niagara Falls and sail through a series of stone-built locks (Figure 2).11 The 1854 Register for Lock 3 on the Second Welland Canal can be used to characterize shipping to and from Toronto while carrying various cargoes. The upbound schooners on the canal, travelling from Toronto, outnumber those vessels that are downbound on the canal, carrying cargoes from the Upper Lakes to the city. Exports from Toronto included cargo such as merchandise, whiskey, or in most cases they were listed as having no cargo.12 About a third of the recorded vessels were travelling to Toronto and the most common cargo being carried was coal from either Erie, Pennsylvania, or Cleveland, Ohio.13 Another frequent cargo shipment to Toronto was timber or lumber.
Comparing this data to the records from 1875 there is a significant increase in imports and exports. This increase in traffic through the Welland Canal illustrates the increase in trade at Toronto. In 1875, although there was a significant increase in ships leaving Toronto, many ships have been written off as carrying no cargo. One of the major exports from Toronto was barley.14 Schooners from Toronto were carrying barley to ports such as Cleveland, Chicago, Illinois, Toledo, Ohio, and Erie.15 Lumber is also documented leaving Toronto to St. Catharines and surrounding areas.16 Once again one of the major imports documented from the Register is an abundance of coal imported to Toronto, not just from Erie, but also Cleveland, Sandusky, and Ashtabula, Ohio.17 This increase in coal imports supports the proliferation of steam engines both in factories and transportation. The Welland Canal Register provides a useful source for understanding the imports and exports that were transiting the Welland Canals, however, additional records need to be explored to fully understand the Lake Ontario trade.
The Tables of Trade and Navigation is a valuable source that outlines every import and export that came through Canada during a given year.18 It is a well-organized government record that specifics each port, and quantifies the specific product, the total value, and its port of origin. The Tables collate data on the trade from 1850 to 1908, with a few years missing. In the early years, they sorted the data by the port but then in 1868, they began to group commodities by province. Throughout the Tables, the switch from the British pound to the Canadian dollar can also be seen. For the sake of comparing, using the Tables of Trade and Navigation from 1853 and 1871 are the best fit as they are the closest available data that corresponds with the Welland Canal Register mentioned above.
A range of commodities were imported and exported to and from Toronto in 1853. Items like coffee and tea, cigars, rum, salt, oil, cotton, and even horses. Comparing the growth in certain commodities helps display the increase that the port experienced throughout the years. In 1853 the Port of Toronto received 17,173 gallons of brandy with a total value of £3514, or $528923.92 in 2023 dollars.19 In 1871 they received 29,004 gallons with a total value of $32,742, or $806032.56 in 2023 dollars.20 Salt also saw a rise in imports, in 1853 Toronto received 7,000 bushels with a total value of £378, or $56896.20 in 2023 dollars.21 Whereas in 1871 the port imported 7,500 bushels with a total value of $1,890, or $261755.57 in 2023 dollars.22 Salt was an important commodity to many Canadians as it was a popular way to preserve food.
Toronto along with many other cities began to make the switch to steam-engine factories, there was a clear increase in the imports of coal to the city to help fuel them. In 1853 the port received 13,100 tons of coal with a total value of £6,518, or $981083.13 in 2023 dollars.23 By 1871 the city was importing 43,034 tons with a total value of $185,984, or $4.579 million in 2023 dollars.24 In 1871, it comes as no surprise that the largest users of steam power were machinery, foundries, and metalworking.25 Not to mention in need for coal because of the increase in the use of steam engines on vessels but also the new development of the railway. The Port of Toronto saw an increase in the import of brandy, salt, and coal from 1853 to 1871 as seen in figure 3.26As remarkable as these historical public government sources are, they do pose a few challenges. Whether certain commodities are simply removed from the documents, or they are categorized differently, or often the quantity measurements change.
| 1853 | 1871 | |
|---|---|---|
| Brandy | 17, 173 gal. | 29,004 gal. |
| Salt | 7,000 bush. | 7,500 bush. |
| Coal | 13, 100 tons | 43, 034 tons |
The Tables of Trade and Navigation also include an in-depth report on exports. One of the largest increases in its exports is barley and rye, which can also be supported by the Welland Canal Register. In 1853, Toronto only exported 5 bushels with a total value of £1, or \$150.52 in 2023 dollars.27 In 1871 the exportation numbers jumped to 1,318,662 bushels with a total value of \$922,297, or \$22.705 million in 2023 dollars.28 Within the Register, there are many recorded ships carrying barley as cargo to places such as Cleveland, Chicago, and Toledo. One reason for the surge in barley exports could be credited to the rising cost of coarse grains in the United States, leading Lower Canada to export more barley to their American counterparts.29 During the Civil War in America, farmers in the Mohawk Valley were abandoning their barley crops allowing Canadian farmers and barley exporters to help fill the demands of the brewers in Albany, New York.30 Barley grows best in cooler climates, making it suitable for farmers in the Toronto region to not only successfully grow a large sum but then sell it. It is a very adaptable grain that may be utilized as food, animal feed, and fuel.31 The Port of Toronto was a key location for trade and commerce and as the imports and exports grew over the years, the port itself had to grow with it. This impacted the city’s economy, as it allowed for more jobs and opportunities.
The increase in commodities entering the port caused multiple dilemmas because there was a need to expand and create more room for commercial ships, it left the city and private owners in a conflict. With the pressure to expand for not only water shipments but to accommodate railway systems, the City of Toronto started to take its role as owner and arbiter of public land and assume larger dimensions of its waterfront.32 This left many private owners unhappy as their methods of evaluating land differed. Divided control became a problem, the city wanted to expand for commercial use and services, to better the community and economy, but many businessmen, railway companies, and shippers did not help maintain the channels of access.33 This leads to issues regarding waterfront development. It is challenges like this that help examine just how the growth of trade and commerce in Toronto affected the city on a wider scale.
| Exports | Imports | |
|---|---|---|
| 1850 | £67,557 | £634,722 |
| 1853 | £221,490 | £1,165,056 |
| 1873 | $2,282,171 | $14,594,203 |
Figure 4: Toronto Imports and Exports, 1850, 1853 and 1873.
A helpful way to look at the growth that the trading industry experienced in the Port of Toronto is by looking at the return totals that the Tables of Trade and Navigation provide within their documents. The total value of exports that entered the Port of Toronto in 1850 was £67,557, in 1853 the total was £221,490, whereas in 1873 the total value of exports was \$2,282,171, or \$10.745 million, \$33.338 million, and \$56.984 million in 2023 dollars respectively.34 The total value of imports that entered the Port of Toronto in 1850 was £634,722, in 1853 it already jumps to over a million with the total being £1,165,056, or \$100.956 million and \$175.364 million in 2023 dollars respectively.35 By 1873 the total value of imports entering the port was \$14,594,203, or \$364.408 million in 2023 dollars.36 By providing these totals and comparing them through Figure 4, the immense advancements made within Toronto’s economy are undeniable.37
As commodities and trade increased over the mid-to-late 19th century, an increase in shipping was needed to meet the demand. The Tables of Trade and Navigation indicate that in 1853 the Port of Toronto listed two registered steamers with 162 registered tonnage, engaged in import.38 Whereas by 1875, the port listed 6 registered steamers with 199 registered tonnage and three registered sailing vessels with 907 registered tonnage.39 The data illustrates that there is a clear increase in both registered vessels and tonnage that occurred during this period, which would have supported the expansion of labour, port facilities, and the trade to and from Toronto.

As illustrated, it is without a doubt that the increase in trade and commerce played a crucial role in Toronto’s development. The city and the port itself had to expand over the years in order to keep up with the growing population. From 1851 to 1861 Toronto’s population grew from 30,775 to 44,821 and needed to accommodate the new manufacturers and factories, new railroads, and cargo being transported through the lakes.40 The expansion of the city and harbour can be seen by exploring historic maps. Figure 1 depicted earlier portrays Toronto in 1842, with seven wharves located along the harbour, and a view of the city with streets, blocks, and buildings. Although this map displays an already lively city, when comparing it to a map done by cartographer Henry Francis Walling in 1875, there is an immense amount of growth within the city and the port (Figure 5).41 The harbour itself shows many more shipyards or wharves, stretching much further along the waterfront, there is also a much clearer visual of the railway that connects to the port, and the city is also much larger and more developed. The influx of commodities from the port of Toronto in the mid to late 19th century can be credited for assisting in the urbanization of the city. With the harbour making a perfect spot for commerce and trade, new organizations and companies had to form, not only the Toronto Board of Trade, and the Harbour Trust, but the Toronto Stock Exchange in 1852.42 A few years later the Bank of Toronto and Canada Permanent Mortgage Company were
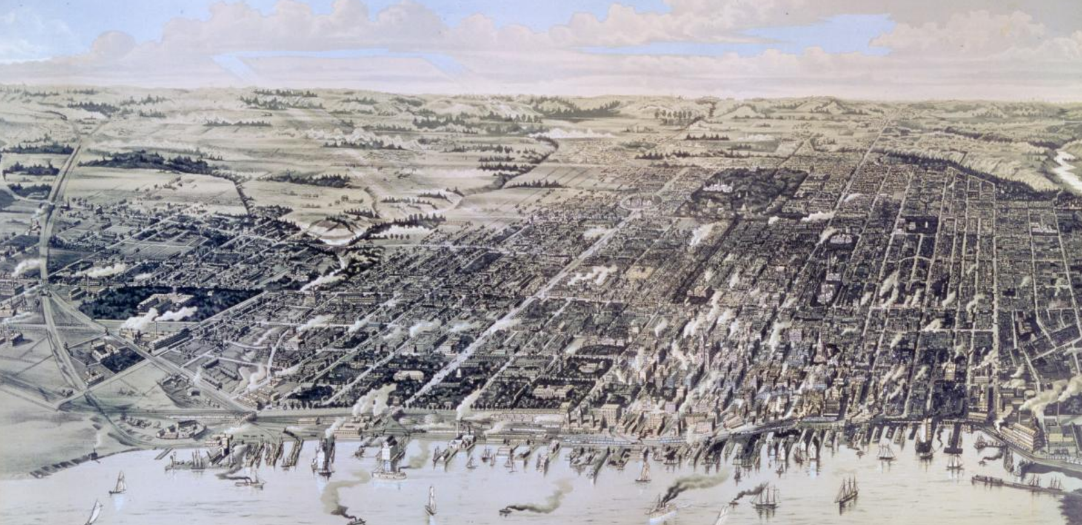
created in 1855.43 These organizations would not have been started if it was not for the passionate citizens who saw the potential and success that the port was experiencing. Toronto grew alongside the port, and the major increase in coal imports can be attributed to the expansion of steam engine-run factories that were now all over the city. Examining the trade records and canal registers illustrates the importance of the marine trade to the development of Toronto and the key 19th-century imports and exports that shaped the port. By the 1880s, the Port of Toronto continued to expand, as captured in this 1886 bird’s eye view by Nathaniel Wesbroom (Figure 6).44 As industry and technology developed, the port has continually evolved to meet the demands of its citizens and continues to be an important and crucial part of Toronto’s economy today.
-
“225 Years of Port Activity,” PortsToronto, https://www.portstoronto.com/port-of-toronto/225-years-of-port-activity.aspx. ↩
-
James H. Marsh, "Toronto Feature: Fort Rouillé." The Canadian Encyclopedia. Historica Canada. Article published March 03, 2013; Last Edited July 02, 2015. https://www.thecanadianencyclopedia.ca/en/article/toronto-feature-fort-rouille ↩
-
Figure 1: Toronto in 1842. James Cane, “Topographical plan of the city and liberties of Toronto, in the province of Canada, 1842,” Topographical map, York University. https://digital.library.yorku.ca/yul-1150262/topographical-plan-city-and-liberties-toronto-province-canada ↩
-
Elizabeth Bloomfield, “Boards of Trade and Canadian Urban Development.” Urban history review 12, no. 2 (1983): 77–99, 77. ↩
-
Bloomfield, “Boards of Trade and Canadian Urban Development.” 83. ↩
-
Gregory S. Kealey, “Toronto Workers Respond to Industrial Capitalism, 1867-1892.” Toronto, CA: University of Toronto Press, (1991): 4. ↩
-
Randy William Widdis, “‘Across the Boundary in a Hundred Torrents’: The Changing Geography of Marine Trade Within the Great Lakes Borderland Region During the Nineteenth and Early Twentieth Centuries.” Annals of the Association of American Geographers 101, no. 2 (2011): 357 http://www.jstor.org/stable/27980182. ↩
-
Mark G. McGowan, and Michael Chard, “Great Famine History.” Canada Ireland Foundation, December 8, 2021. https://www.canadairelandfoundation.com/great-famine-history/ ↩
-
Michael Moir, "The Toronto Harbour Commission Archives". Urban History Review / Revue d'histoire urbaine 17, no. 2 (1988): 112. https://doi.org/10.7202/1017657ar. ↩
-
“Brief History.” Welland Canal. https://www.wellandcanal.com/hist.htm ↩
-
“Brief History.” Welland Canal; Figure 2: Lock 3 of the second Welland Canal, ca. 1900, black and white photograph, 6” x 6.5”, Francis J. Petrie Collection, Niagara Falls Public Library. ↩
-
Welland Canal Register (Library and Archives of Canada, Vessel Registers Lock 3), 1854. ↩
-
Welland Canal Register, 1854. ↩
-
Welland Canal Register (Library and Archives of Canada, Vessel Registers Lock 3 1875-1877, RG 43 Vol. 2406), 1875. ↩
-
Welland Canal Register, 1875. ↩
-
Welland Canal Register, 1875. ↩
-
Welland Canal Register, 1875. ↩
-
Government of Canada, Table of the Trade and Navigation of the Province of Canada for the Year…” https://publications.gc.ca/site/eng/9.843286/publication.html ↩
-
Government of Canada, Public Services and Procurement Canada. “Tables of the Trade and Navigation of the Province of Canada for the Year ....: CS4-4E-Pdf.” Government of Canada Publications - Canada.ca, 1853; Historical Currency Conversions, https://futureboy.us/fsp/dollar.fsp ↩
-
Government of Canada, Public Services and Procurement Canada. “Tables of the Trade and Navigation of the Province of Canada for the Year ... .: CS4-4E-Pdf.” Government of Canada Publications - Canada.ca, 1871, 286. https://publications.gc.ca/collections/collection_2017/statcan/4-4/CS4-4-1871-eng.pdf; Historical Currency Conversions. ↩
-
Government of Canada, 1853, 67; Historical Currency Conversions. ↩
-
Government of Canada, 1871, 288; Historical Currency Conversions. ↩
-
Government of Canada, 1853, 253; Historical Currency Conversions. ↩
-
Government of Canada, 1871, 286; Historical Currency Conversions. ↩
-
Kealey, “Toronto Workers Respond to Industrial Capitalism, 1867-1892,” 25. ↩
-
Figure 3: Table Comparing the Total Amount of Imports. Government of Canada, 1871, 286; Government of Canada, 1853, 67; Government of Canada, 1871, 288. ↩
-
Government of Canada, 1853, 405; Historical Currency Conversions. ↩
-
Government of Canada, 1871, 375; Historical Currency Conversions. ↩
-
Robert Leslie Jones, “The Agricultural Development of Lower Canada, 1850-1867.” Agricultural History 19, no. 4 (1945): 214. http://www.jstor.org/stable/3739400. ↩
-
Jones, “The Agricultural Development of Lower Canada, 1850-1867,” 217. ↩
-
“Growing Barley in Ontario,” Ontario Farms and Land Group - Farm Real Estate, April 28, 2022, https://ontariofarmsandland.com/2021/12/07/growing-barley-in-ontario. ↩
-
Frances Nordlinger Mellen. "The Development of the Toronto Waterfront During the Railway Expansion Era, 1850-1912." Order No. NK31286, University of Toronto (Canada), 1974. ↩
-
Frances Nordlinger Mellen " The Development of the Toronto Waterfront,” 80. ↩
-
Government of Canada, 1853, 463; Government of Canada, 1853, 463; Government of Canada, 1873, 720; Historical Currency Conversions. ↩
-
Government of Canada, 1853, 463; Historical Currency Conversions. ↩
-
Government of Canada, 1873, 720; Historical Currency Conversions. ↩
-
Figure 4: Toronto Imports and Exports, 1850, 1853 and 1873. Government of Canada, 1853, 463; Government of Canada, 1873, 720. ↩
-
Government of Canada, 1853, 477. ↩
-
Government of Canada, 1873, 839. ↩
-
Malcolm E. Davidson. “Changing Patterns of Great Lakes Vessel Ownership As a Factor in the Economic Development of Toronto, 1850-1860.” Urban History Review / Revue d’histoire Urbaine 16, no. 3 (1988): 242–54. http://www.jstor.org/stable/43559426 ↩
-
Figure 5: Street map of Toronto published in 1875. Henry Francis Walling, City of Toronto, reduced by permission from Wadsworth & Unwin’s Large Map for Tackabury’s Atlas of the Dominion published by G.N. Tackabury, Montreal, 1875 [map]. 1:8,700. Tackabury: Montreal, 1875. https://digital.library.yorku.ca/yul-1153579/city-toronto-reduced-permission-wadsworth-unwins-large-map-tackaburys-atlas-dominion ↩
-
Malcolm E. Davidson, “Changing Patterns of Great Lakes Vessel Ownership,” 243. ↩
-
Davidson, “Changing Patterns,” 243. ↩
-
Figure 6: Birds eye view of Toronto 1886. William Nathaniel Wesbroom. Toronto, Ontario, 1886, Bird's-Eye View, Looking North from Harbour to Bloor St. Photograph. Toronto, 1886. Toronto Public Library. https://digitalarchive.tpl.ca/objects/354323/toronto-ontario-1886-birdseye-view-looking-north-from ↩